Understanding the Essential Components of Flowcharts
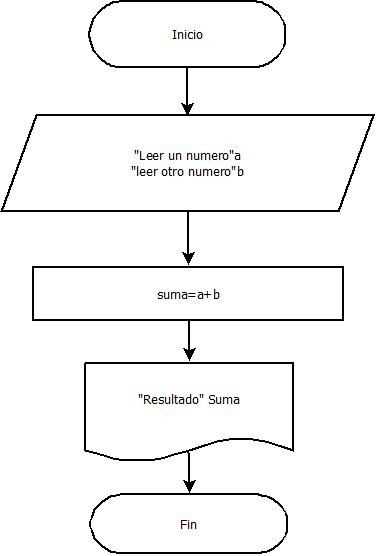
In the realm of visual representation of processes, the ability to break down complex systems into comprehensible segments is essential. This structured approach not only aids in clarity but also enhances communication among team members, facilitating a shared understanding of workflows. By dissecting these intricate frameworks, we can uncover efficiencies and identify potential areas for improvement.
Each component within this visual schema serves a specific function, contributing to the overall effectiveness of the diagram. Understanding these elements allows individuals and organizations to better analyze tasks, decision points, and the flow of information. Embracing this method can lead to more informed decision-making and streamlined operations.
As we delve deeper into the individual components, it becomes evident that each plays a crucial role in depicting the sequence of activities and interactions. By exploring these aspects, we gain valuable insights that can transform the way we approach process management and optimization.
Understanding Flowchart Basics
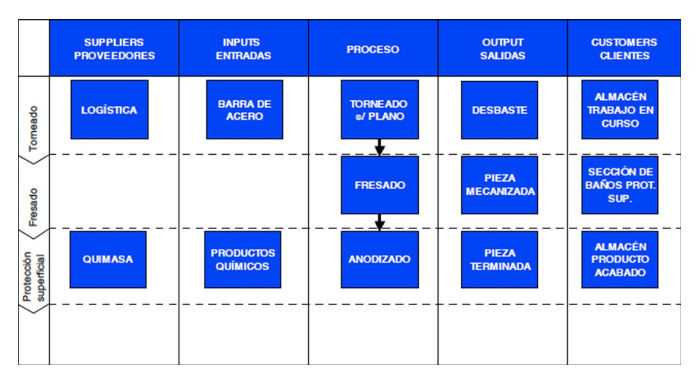
Visual representations of processes are essential for simplifying complex information and improving communication. They provide a clear way to illustrate the sequence of steps involved in various activities, making it easier for individuals to understand and follow procedures. By organizing ideas in a systematic manner, these diagrams enhance both learning and efficiency.
Key Components of Visual Representations
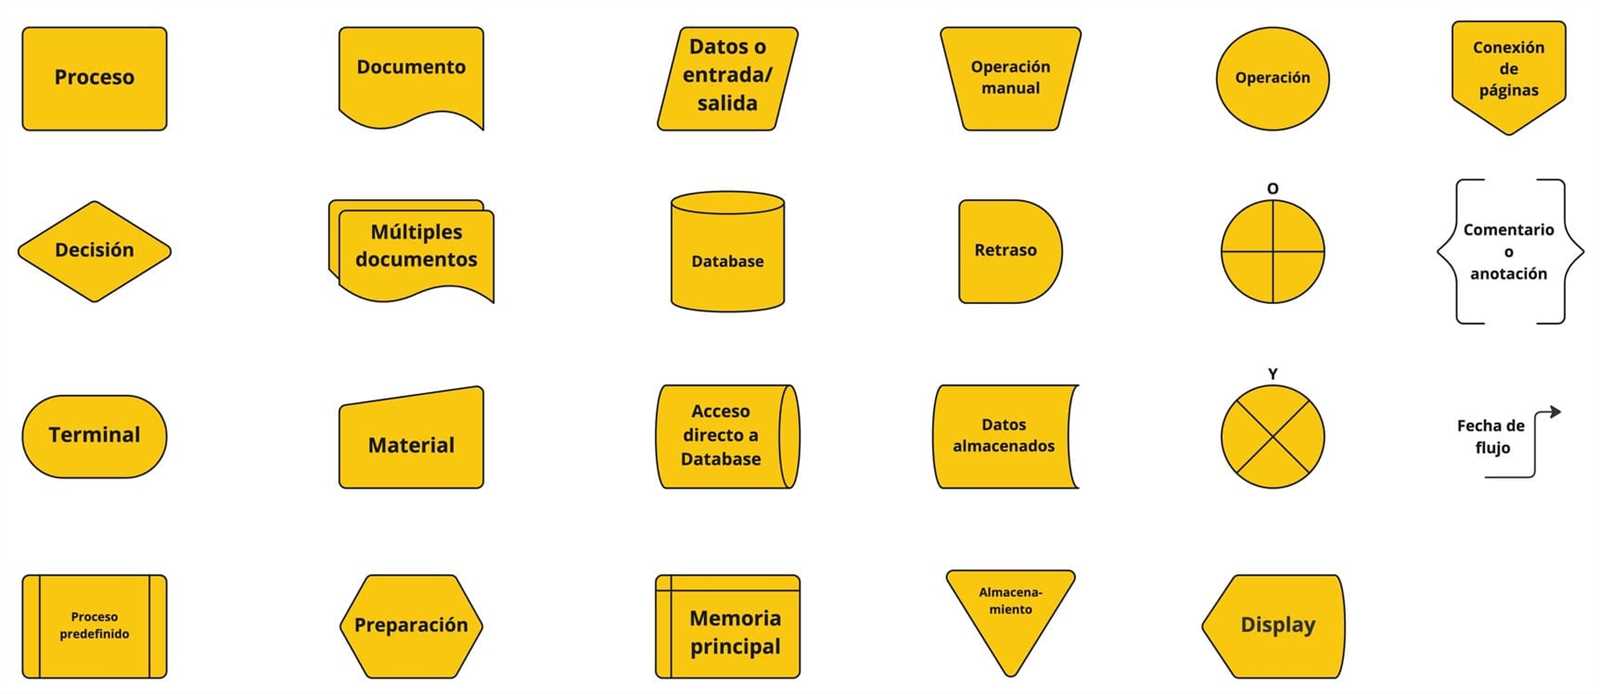
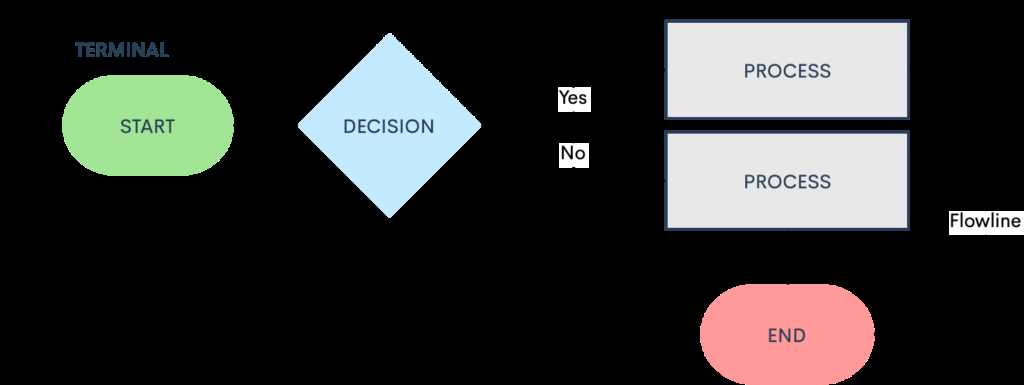
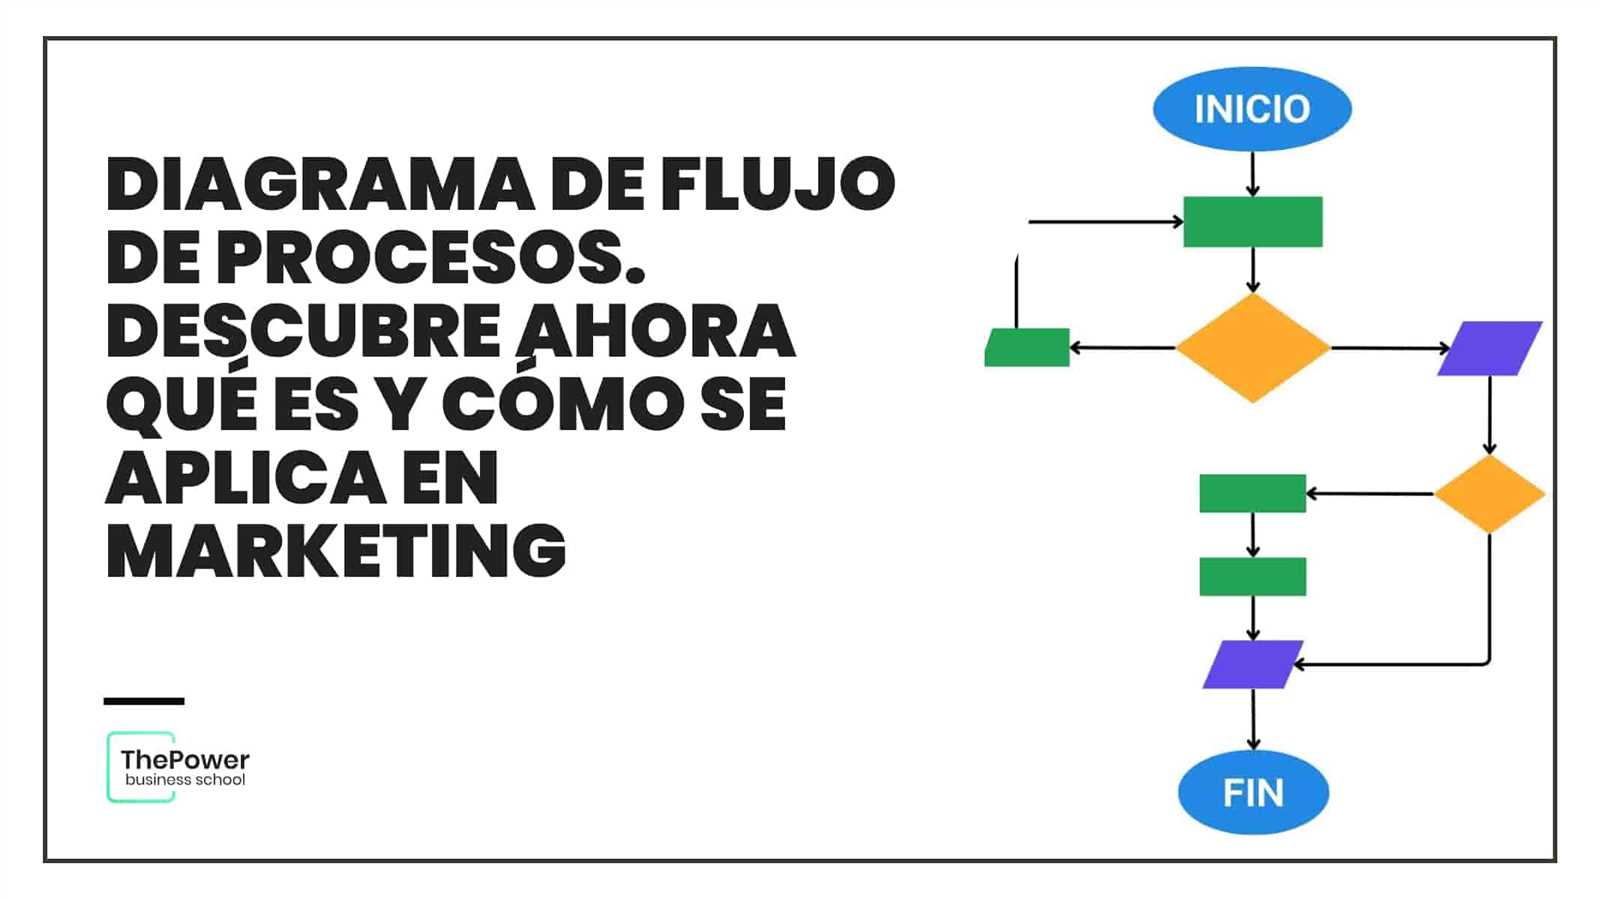
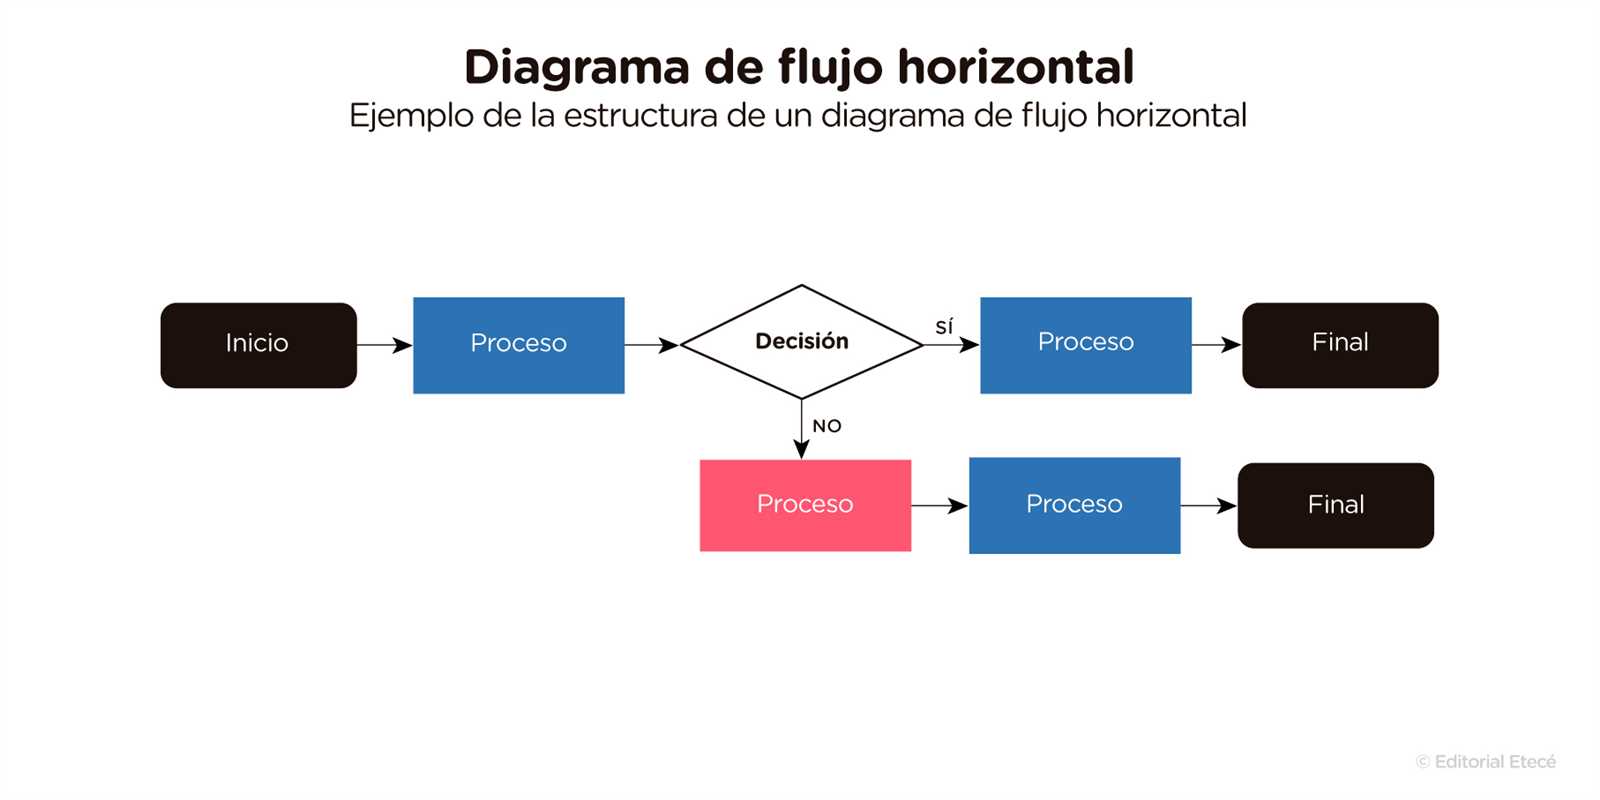
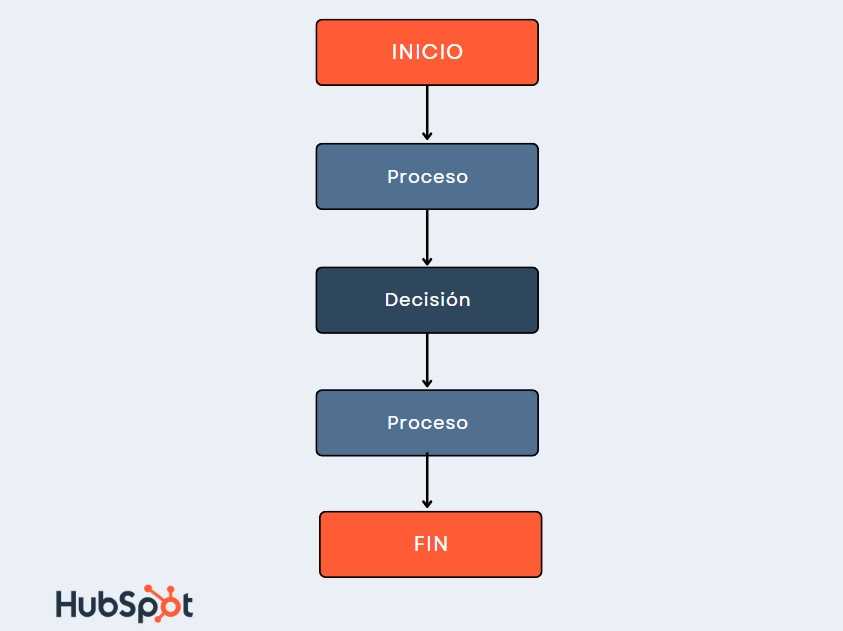
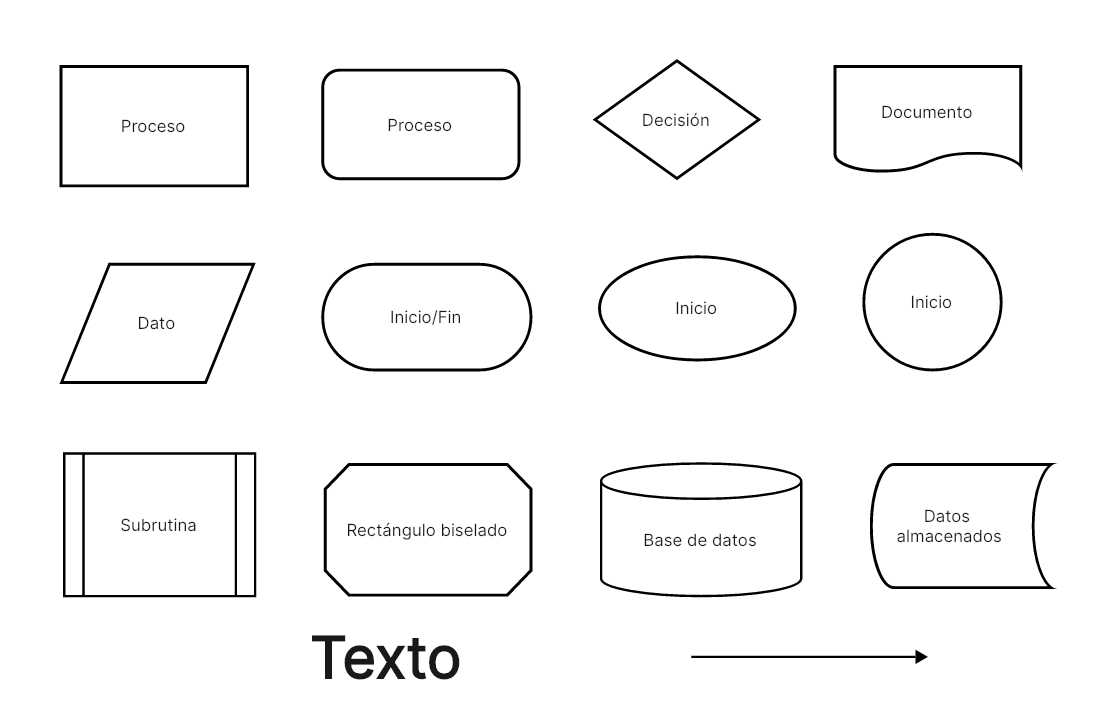
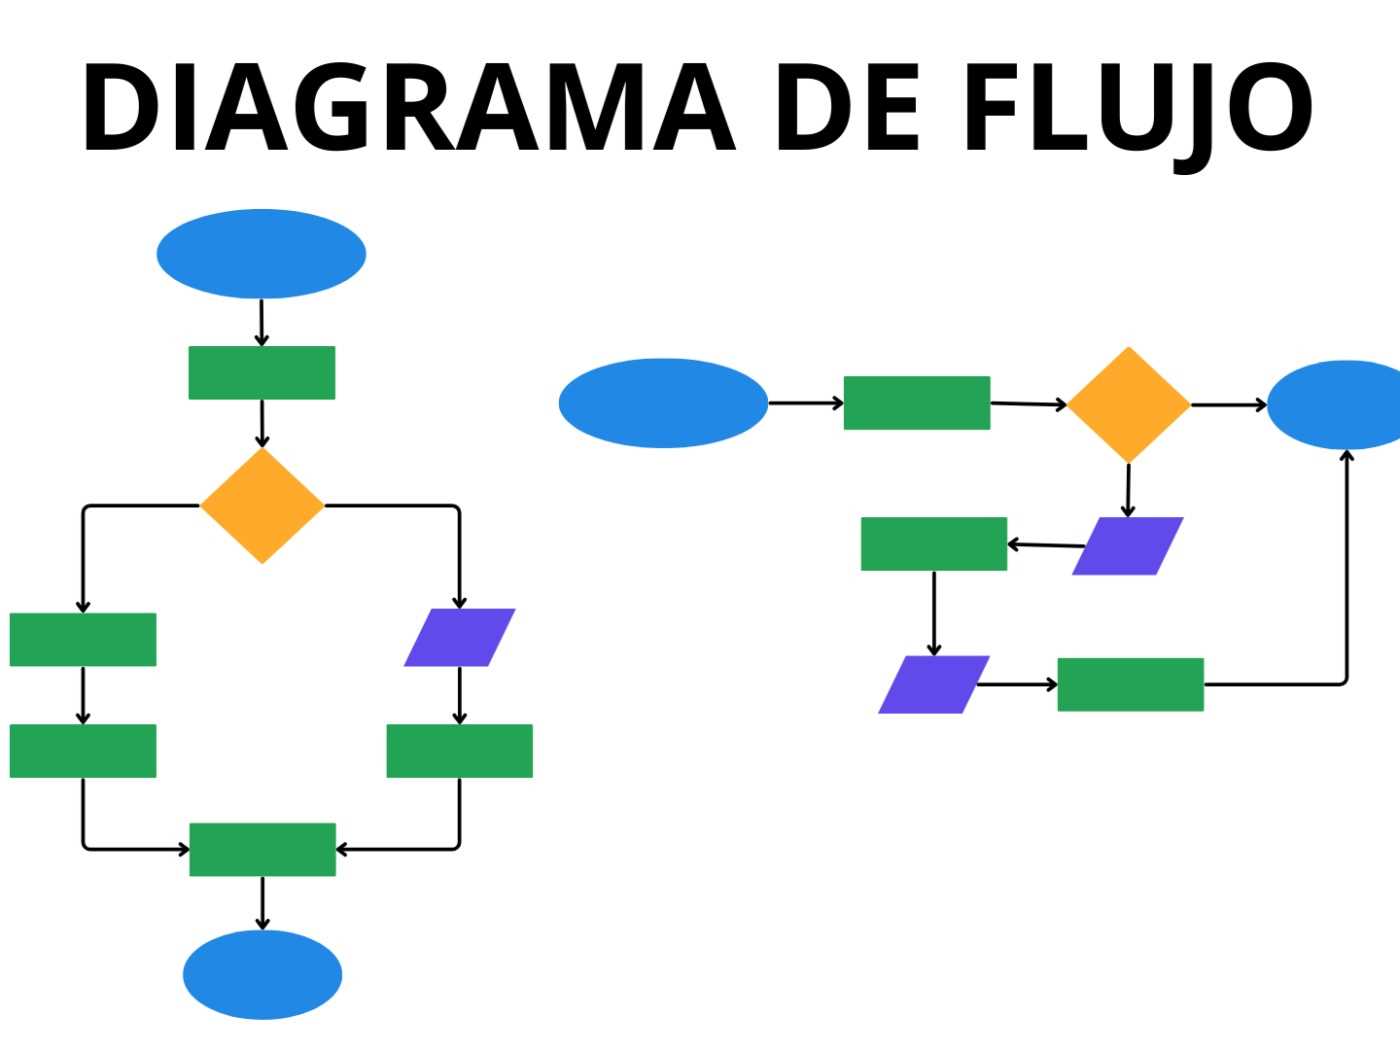
Every diagram typically consists of various symbols, each serving a specific purpose. Common shapes include ovals for starting and ending points, rectangles for actions or processes, and diamonds for decision points. Understanding the role of each symbol is crucial for interpreting and creating effective representations. This clarity helps ensure that everyone involved is on the same page.
Benefits of Using Visual Process Representations
Employing these graphical tools offers numerous advantages. They facilitate better retention of information, as visuals are often easier to remember than text alone. Additionally, they encourage collaboration among team members by providing a common reference point. Ultimately, these representations streamline workflows and contribute to more productive outcomes.
Components of a Flowchart
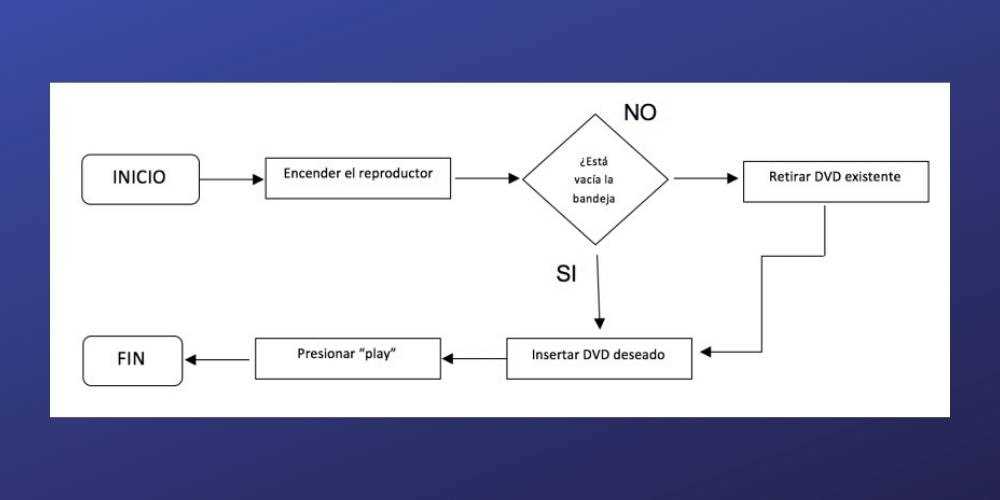
Understanding the essential elements of a visual representation can greatly enhance clarity and communication in any process. Each component plays a crucial role in conveying information effectively and ensuring a logical flow of ideas.
Shapes are fundamental to these visual aids, with each form representing a specific type of action or decision. For instance, ovals typically indicate the start or end, while rectangles denote tasks or processes.
Arrows serve as connectors, illustrating the direction of flow between the different elements. They guide the viewer through the sequence, making the relationships clear and intuitive.
Diamonds represent decision points, where a choice must be made that will affect the subsequent path. This component is vital for highlighting critical junctures within the process.
Lastly, annotations or notes can provide additional context, helping to clarify complex steps or decisions without overcrowding the visual layout.
Types of Flowchart Symbols
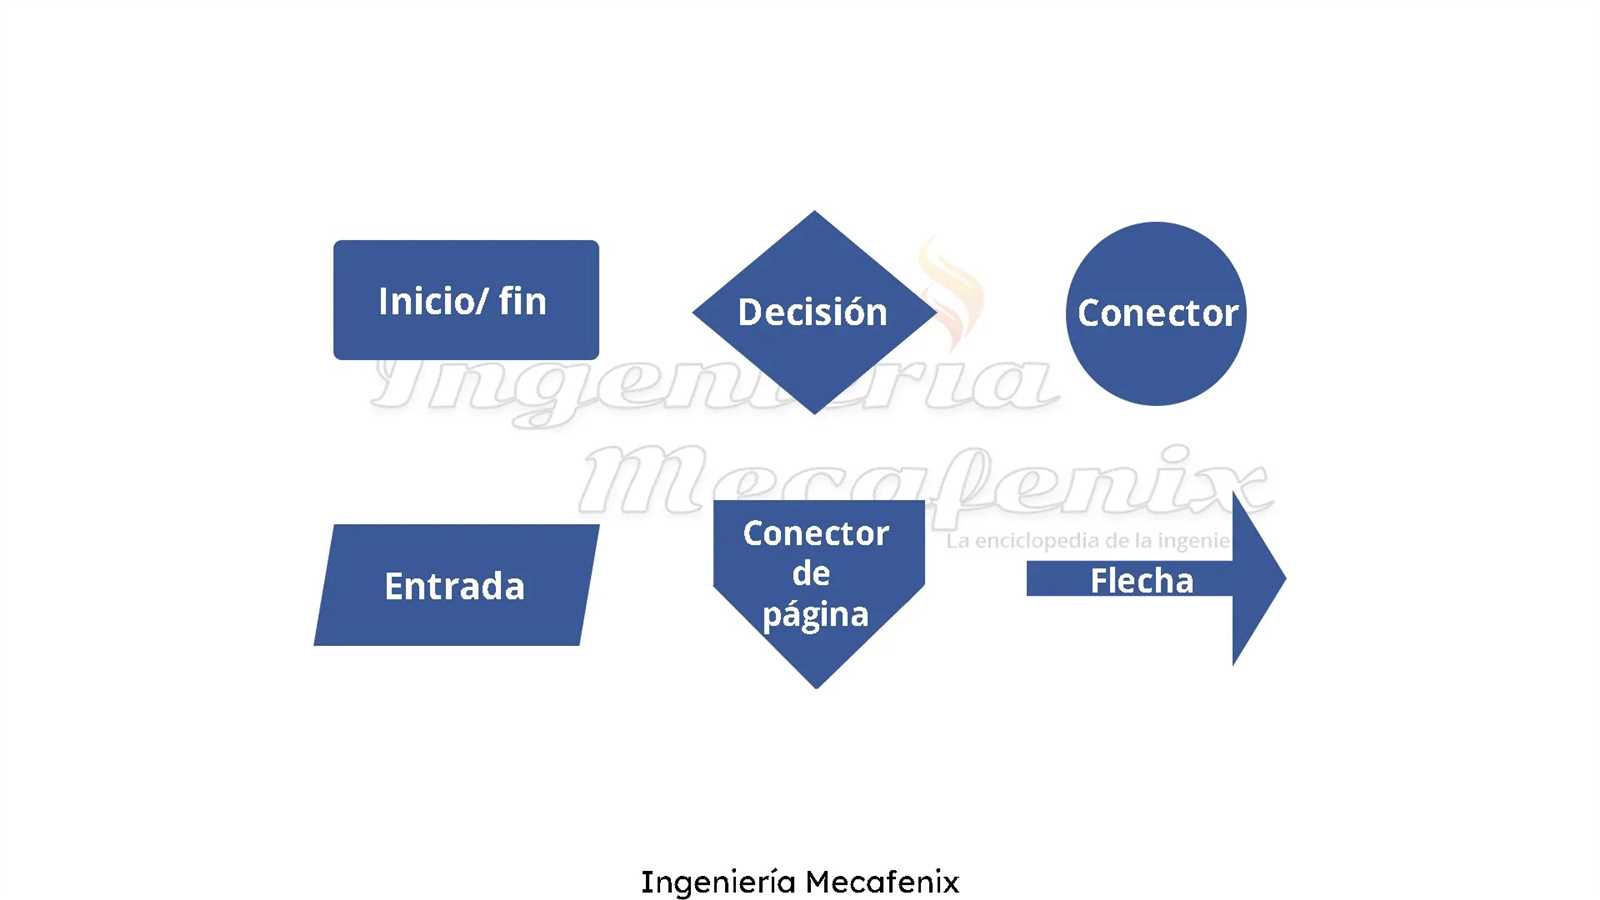
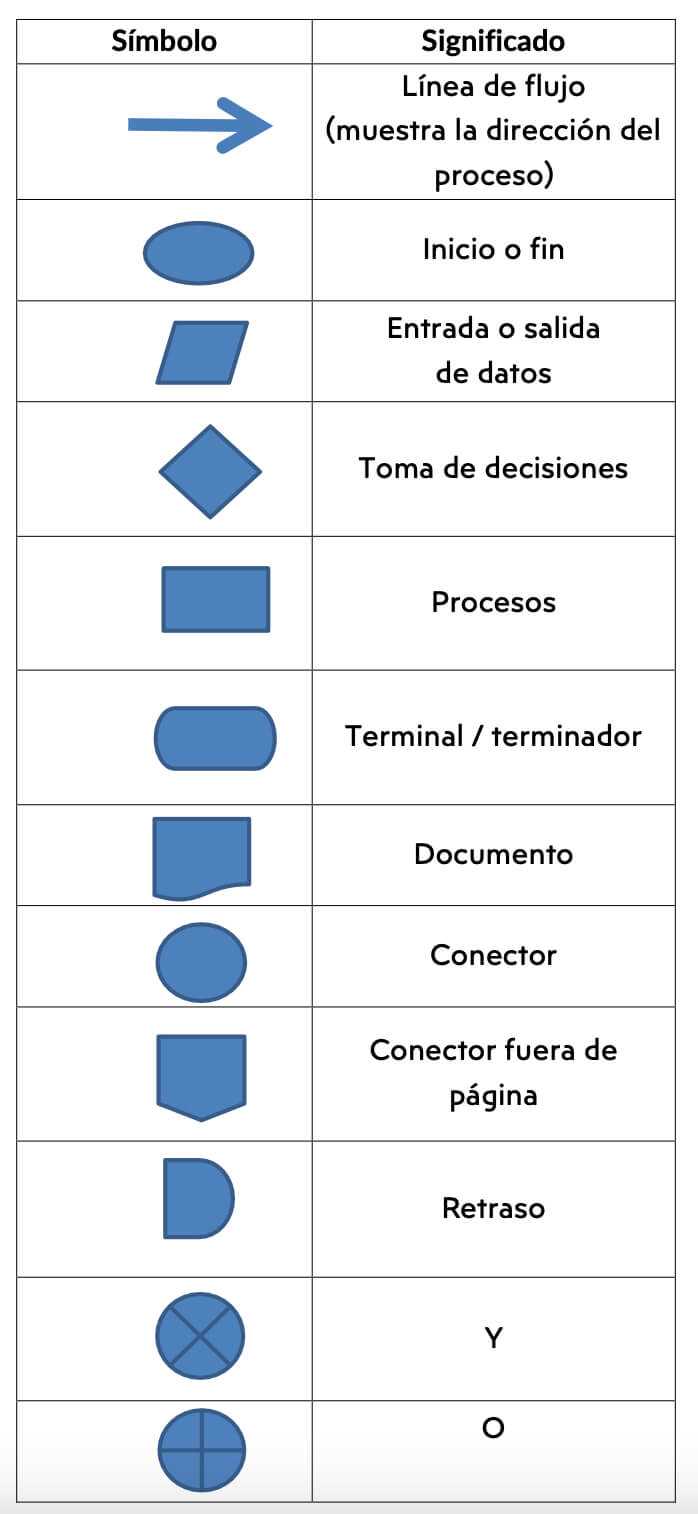
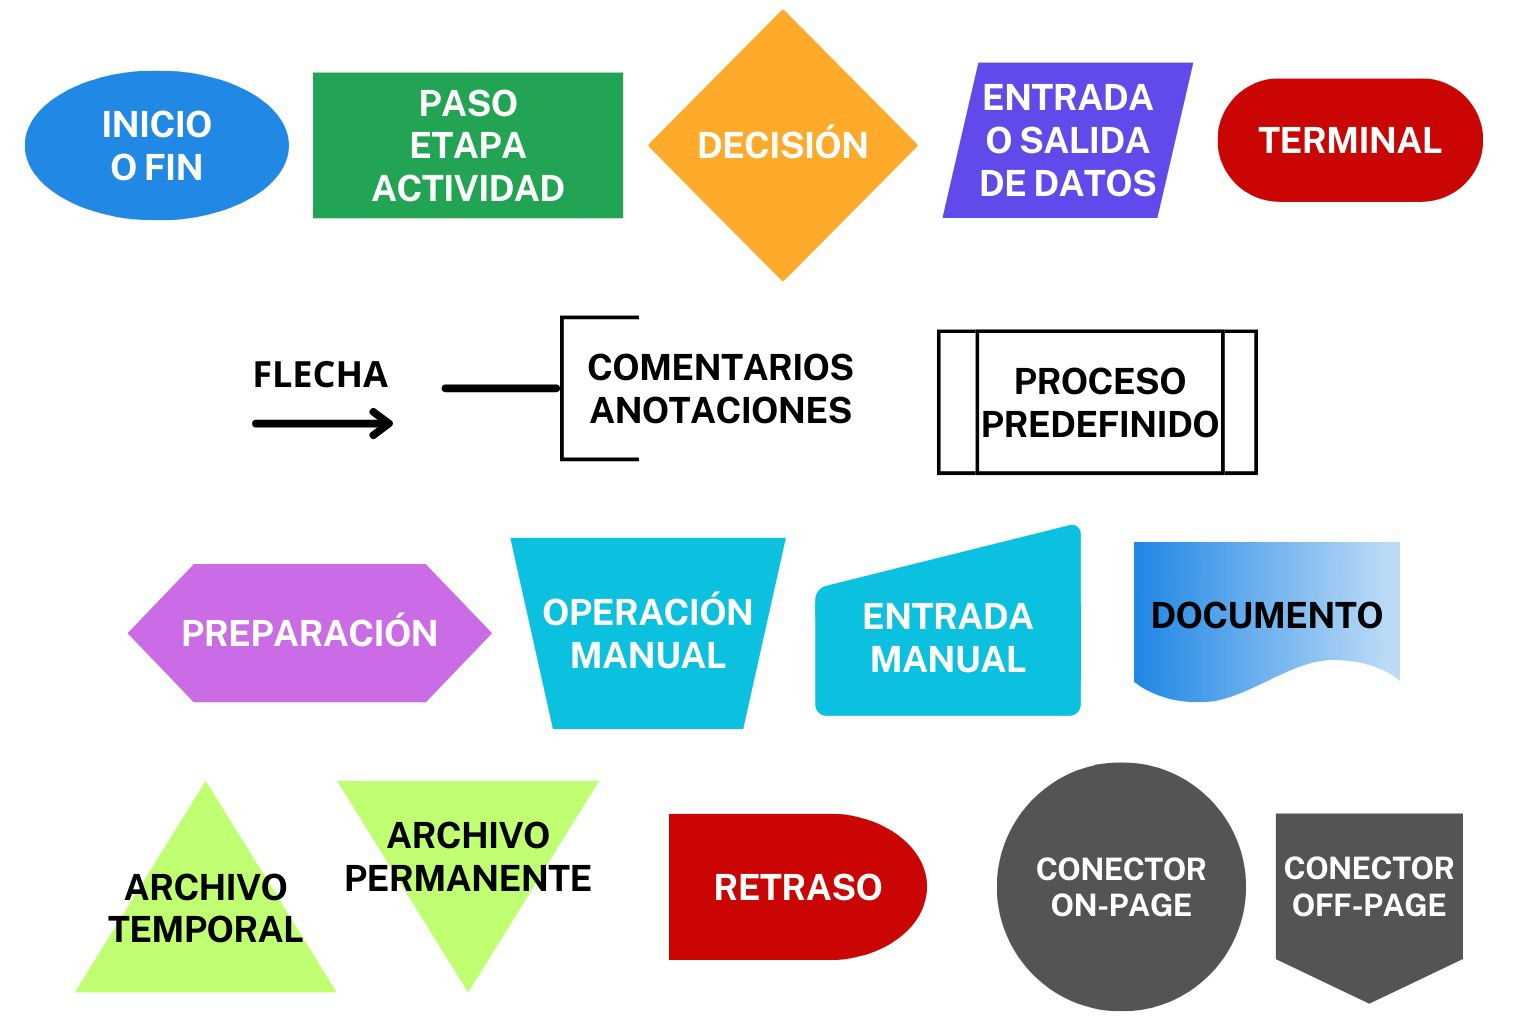
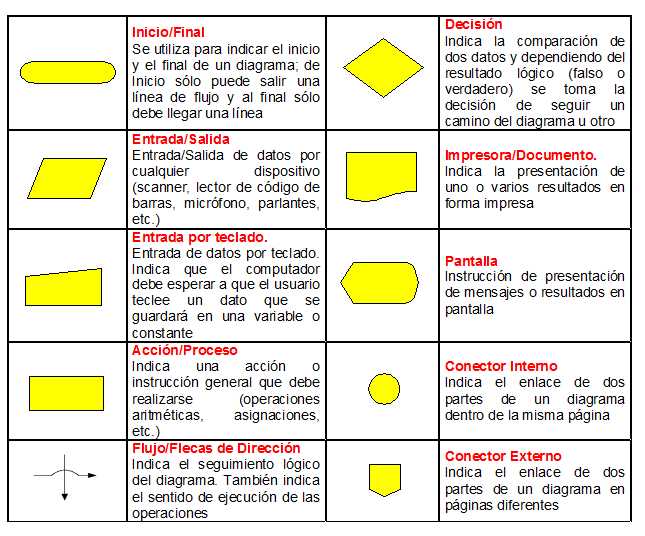
Flowcharts utilize a variety of symbols to represent different types of actions or steps in a process. Understanding these symbols is essential for effectively communicating complex information. Each symbol has a unique meaning, contributing to the overall clarity of the diagram.
Here are some common symbols used in these diagrams:
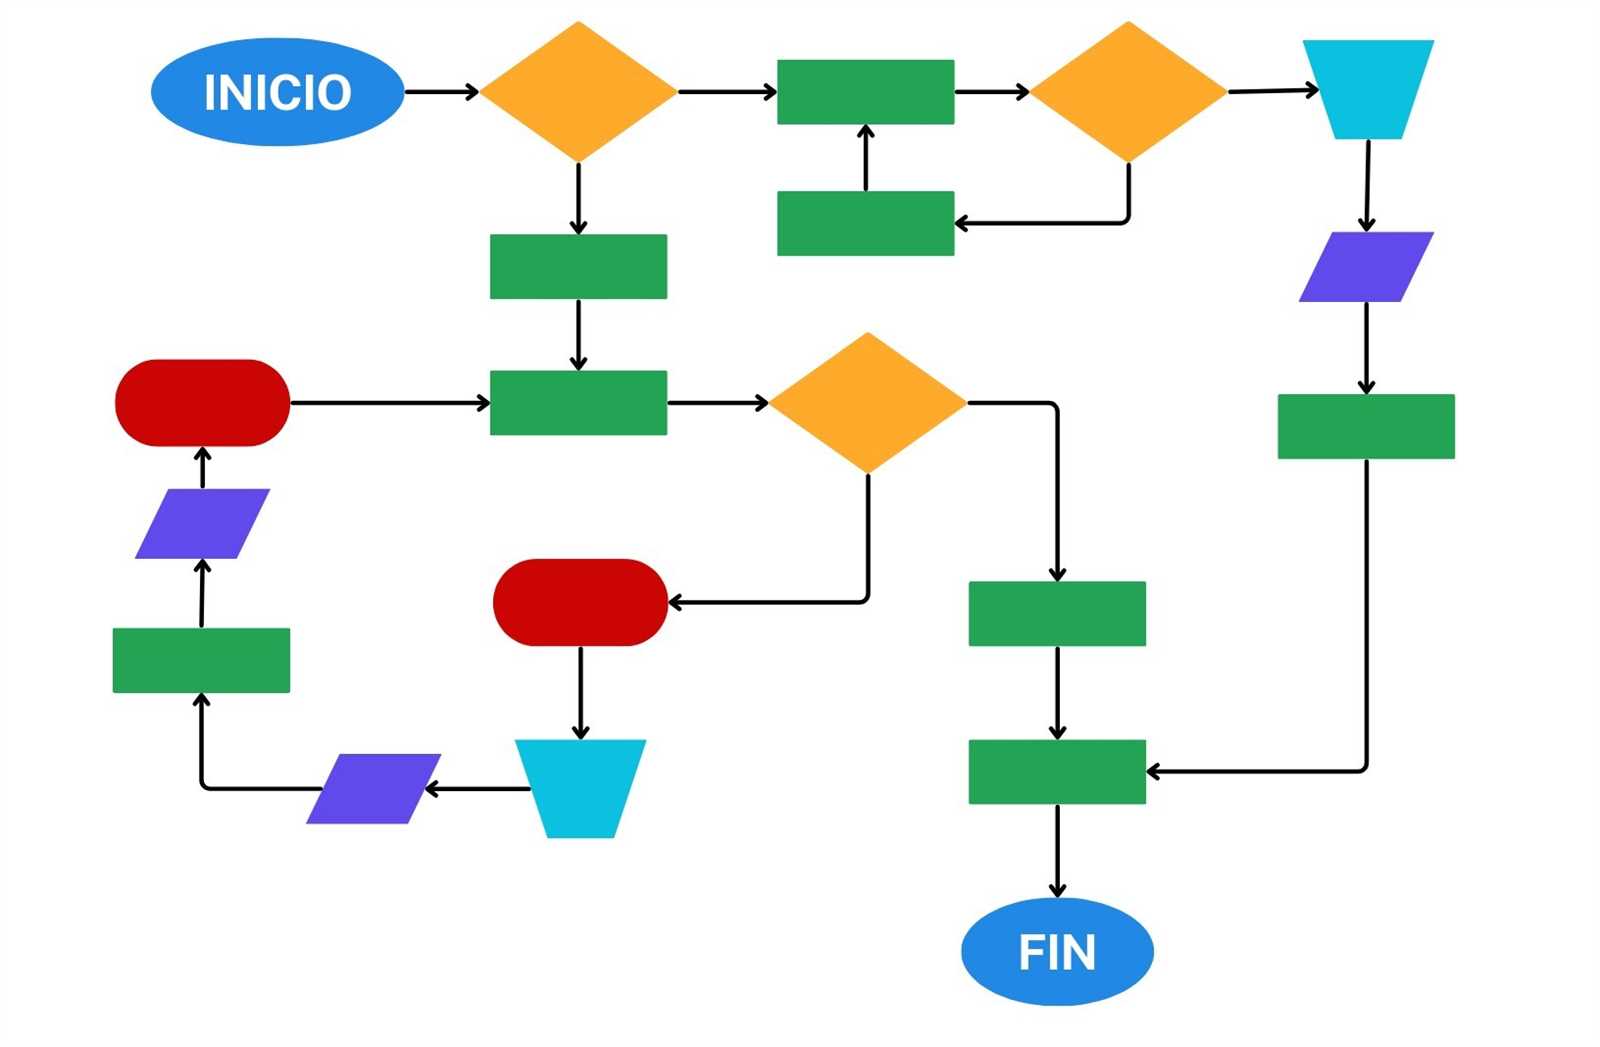
- Oval: Represents the start or end of a process.
- Rectangle: Indicates a process step or an action to be taken.
- Diamond: Denotes a decision point, where a choice must be made.
- Parallelogram: Used for input or output operations, such as data entry or results.
- Arrow: Shows the direction of flow between symbols.
Each of these shapes serves a distinct purpose, allowing for a structured representation of workflows and procedures. Proper usage of symbols ensures that the information is conveyed clearly and effectively.
In addition to the basic symbols, there are also specialized ones that cater to specific industries or methodologies:
- Document: Depicts a document or report that is generated during the process.
- Predefined Process: Indicates a set of operations that are defined elsewhere, often used for sub-processes.
- Manual Input: Represents data that must be manually entered into the system.
- Delay: Shows a waiting period in the process.
Familiarizing oneself with these various symbols enhances the ability to create comprehensive diagrams that are easy to understand, facilitating better communication and analysis of processes.
How to Create Flowcharts
Crafting a visual representation of a process can enhance understanding and communication. These diagrams serve as valuable tools for illustrating the steps involved, making complex information easier to digest. By following a systematic approach, anyone can create effective visual guides that clarify workflows and decision-making pathways.
Step-by-Step Process

Begin by identifying the primary objective of your visual representation. Gather all relevant information and outline the key steps involved. It’s essential to use clear symbols and arrows to denote the flow of the process. This helps viewers easily follow the sequence of actions and decisions.
Tools and Software
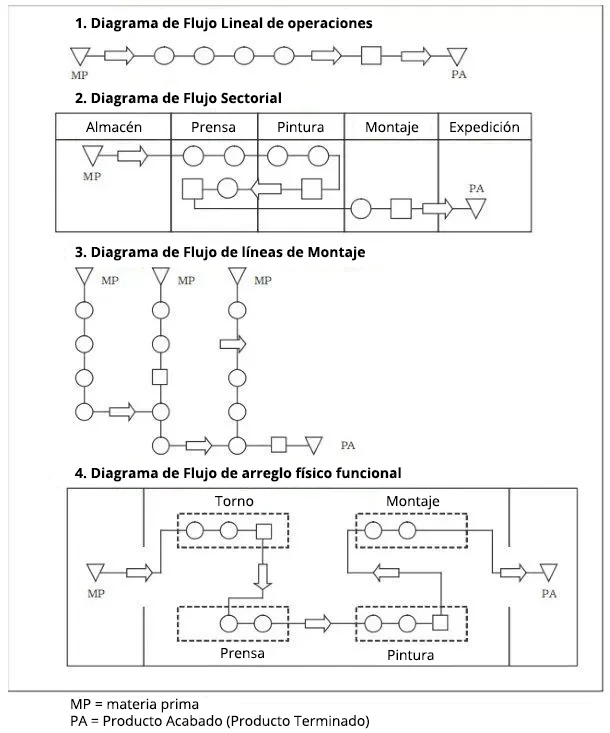
There are numerous tools available, both online and offline, to assist in creating these diagrams. Software such as Lucidchart, Microsoft Visio, or even basic drawing programs can facilitate the design process. Choose a tool that suits your needs, ensuring it offers intuitive features for easy diagram creation.
Applications in Business Processes
In today’s dynamic landscape, visual representations of processes play a crucial role in optimizing efficiency and communication within organizations. By mapping out workflows, businesses can identify bottlenecks, streamline operations, and enhance collaboration among teams.
Utilization in Project Management: These visual tools are essential in project management, as they provide clarity on task sequences and responsibilities. They help in tracking progress and ensuring that all stakeholders are aligned towards common goals.
Enhancing Customer Service: In customer service, visual models enable teams to understand customer journeys. By examining each touchpoint, companies can improve response times and overall customer satisfaction.
Training and Development: They are also invaluable for training purposes. New employees can quickly grasp complex workflows, allowing them to integrate seamlessly into their roles and contribute effectively from the outset.
Strategic Planning: During strategic planning, these visual aids help organizations delve into their operational structures, fostering discussions that lead to informed decision-making and long-term success.
Ultimately, the integration of these representations into various business processes enhances clarity, efficiency, and collaboration, paving the way for sustained growth and innovation.
Flowcharts for Software Development
Visual representations are essential in the realm of software creation, providing a clear roadmap of processes and decisions. These diagrams help teams communicate complex ideas succinctly, ensuring everyone is on the same page from inception to deployment.
Benefits of Visual Representations
- Enhanced Communication: They bridge the gap between technical and non-technical team members.
- Improved Planning: Visual aids help identify potential roadblocks and streamline workflows.
- Documentation: They serve as a valuable reference throughout the development lifecycle.
Common Uses in Development
- Process Mapping: Outlining the steps involved in a project, from requirements gathering to deployment.
- Decision Making: Illustrating various paths based on specific conditions or choices.
- System Design: Providing a high-level view of system architecture and component interactions.
Benefits of Using Flowcharts
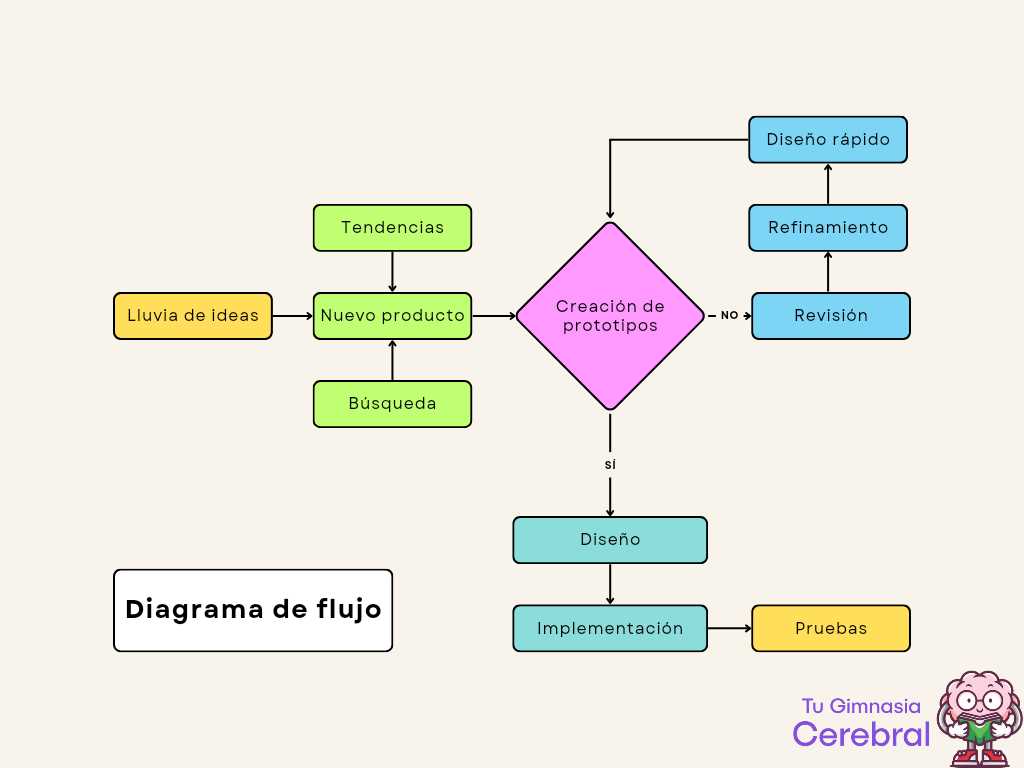
Visual representations of processes offer numerous advantages in simplifying complex information. By mapping out steps, individuals and teams can gain clarity and enhance understanding, making decision-making more efficient.
Improved Communication
Such diagrams facilitate better communication among team members. By presenting ideas visually, misunderstandings are minimized, and everyone can easily follow the process flow.
Enhanced Problem-Solving
These visual tools aid in identifying bottlenecks and inefficiencies. Analyzing the sequence of actions helps teams pinpoint issues quickly, leading to more effective solutions.
Common Mistakes to Avoid
In any process representation, certain pitfalls can significantly hinder clarity and effectiveness. Understanding these common errors is essential for creating a coherent and useful visual aid. Awareness of these issues can lead to improved communication and better outcomes in any project.
Lack of Clarity
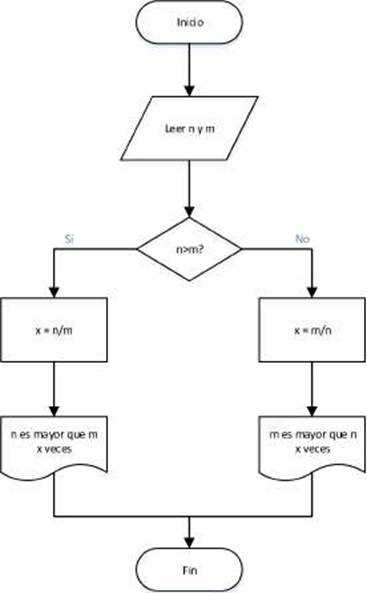
One frequent mistake is failing to provide clear labels and descriptions. Each step should be easily understandable, allowing viewers to grasp the purpose without confusion. Avoid vague terminology that can lead to misinterpretation; instead, opt for precise language that conveys the intended message.
Overcomplication
Another common error is adding unnecessary complexity. While it may be tempting to include every detail, this can overwhelm the audience. Simplification is key; focus on the most relevant information and present it in a straightforward manner. This enhances engagement and facilitates easier comprehension.
Flowcharts in Project Management
Visual representations play a crucial role in managing projects effectively. These graphical tools help illustrate processes, clarify complex tasks, and enhance communication among team members. By mapping out workflows, teams can identify bottlenecks and streamline operations, ultimately driving success.
Benefits of Visual Representations
- Improved communication: Enhances understanding among stakeholders.
- Enhanced clarity: Simplifies complex processes for better comprehension.
- Identification of inefficiencies: Highlights areas for improvement.
Best Practices for Creating Effective Visual Tools
- Define objectives: Clearly outline the purpose of the visual tool.
- Engage stakeholders: Involve team members in the creation process.
- Simplify design: Keep it straightforward to avoid confusion.
- Regular updates: Revise as needed to reflect any process changes.
Case Studies: Effective Use
This section explores practical applications of structured representations in various fields, highlighting how they enhance understanding and decision-making. By examining real-world examples, we uncover the ultimate benefits these tools offer in streamlining processes and improving outcomes.
Healthcare Applications
- Patient Workflow Management: Streamlining patient intake and treatment processes to reduce wait times.
- Emergency Response Protocols: Enhancing communication and efficiency in critical situations.
Business Process Optimization
- Project Management: Clarifying task assignments and timelines to improve team collaboration.
- Customer Service: Mapping out customer interactions to identify pain points and enhance satisfaction.
Integrating Flowcharts with Other Tools
Incorporating visual representations of processes with various software solutions enhances efficiency and clarity. This synergy allows for streamlined workflows, better communication, and improved project management.
Benefits of Integration
- Enhanced Collaboration: Teams can work together seamlessly, sharing insights and updates in real-time.
- Improved Documentation: Integrating visuals with documentation tools ensures that information is accessible and well-organized.
- Increased Productivity: Automating repetitive tasks through integration reduces manual errors and saves time.
Tools for Integration
- Project Management Software: Applications like Trello and Asana can incorporate visuals for better task tracking.
- Communication Platforms: Tools such as Slack or Microsoft Teams allow for sharing and discussing visual aids effortlessly.
- Data Analysis Programs: Integrating with software like Excel can visualize data trends alongside process maps.
Future Trends in Flowchart Design
The evolution of visual representation techniques is set to transform how complex information is conveyed. As technology advances, new methodologies will emerge, enhancing clarity and engagement in communication. This shift will not only streamline processes but also foster collaboration among teams across various fields.
One significant trend is the integration of artificial intelligence, enabling automated generation of visual representations based on user inputs. This innovation will allow for real-time updates and personalized designs, making information more accessible and tailored to specific audiences.
Moreover, interactive elements are becoming increasingly popular. Users can engage with visual materials through clickable features and dynamic content, promoting a more immersive experience. This interactivity encourages deeper understanding and retention of information.
Additionally, the focus on aesthetics is expected to rise, with an emphasis on minimalism and clarity. Well-designed visuals will not only attract attention but also facilitate quicker comprehension, making them essential tools in education and business communication.
Lastly, the rise of remote work highlights the need for collaborative platforms that support visual brainstorming and planning. These platforms will enable teams to work together seamlessly, regardless of location, enhancing productivity and innovation.